Inventory Availibility
A micro-service that provides a 360-degree view of real-time inventory availability across every channel to answer the fundamental questions: “How much inventory do I have?” and “Where is it?" leveraging AI/ML to help you see the full profit potential of your inventory, no matter where it resides.
TEAM
2 Designers, 2 Product Managers, 1 Data Scientist
ROLE
UX Designer II

The Business Problem
In an e-commerce business, the criticality is measured by the operations based on the perfect order score. In terms of delivering timely basis and in a cost-efficient way. These factors are influenced by location, demand, and supply of the stoc,k ultimately determining inventory availability.

Fragmented systems: Inventory data was scattered across multiple spreadsheets and tools.
Managers often needed a middleman to pull the data they needed.
Overstock and understock issues: Some stores had excess products with low demand, while others had high demand but no supply.
Operational inefficiency: All this friction led to delays, poor fulfillment, and even cart abandonment, which directly impacts revenue.


Understanding Roles & Duties
User Research
Personas & Needs


User Journey & Key Flows
Lite Narrative
Let me give a quick story to bring this to life. Imagine a footwear brand with five stores across a city. Each store stocks different products based on local trends.


Finalized UI
We built a high-fidelity prototype and tested it for usability and overall experience with SMEs, the pre-sales team, and select clients. Based on their feedback, we refined the design and conducted a final review with all stakeholders before handing it over to engineering for development.
Dashboard Overview
The Inventory Availability Dashboard gives users a clear snapshot of inventory health, combining real-time metrics and visual insights. A date range selector lets them compare performance across time periods or apply custom ranges for deeper analysis. At the top, key KPIs such as demand, out-of-stock %, in-stock %, and inventory exposure provide quick visibility into overall status. Supporting this, summary cards and charts highlight demand trends, stock levels, and purchase order updates, helping users quickly spot issues like delayed orders or future demand surges

Demand Summary
-
This Demand Dashboard highlights top-performing channels, products, and fulfillment types with clear KPI cards at the top.
-
It allows users to filter, search, and compare performance across selling channels, categories, and products.
-
The detailed table view provides granular insights into quantity, change, available-to-promise (ATP), and fulfillment, supporting quick decision-making.

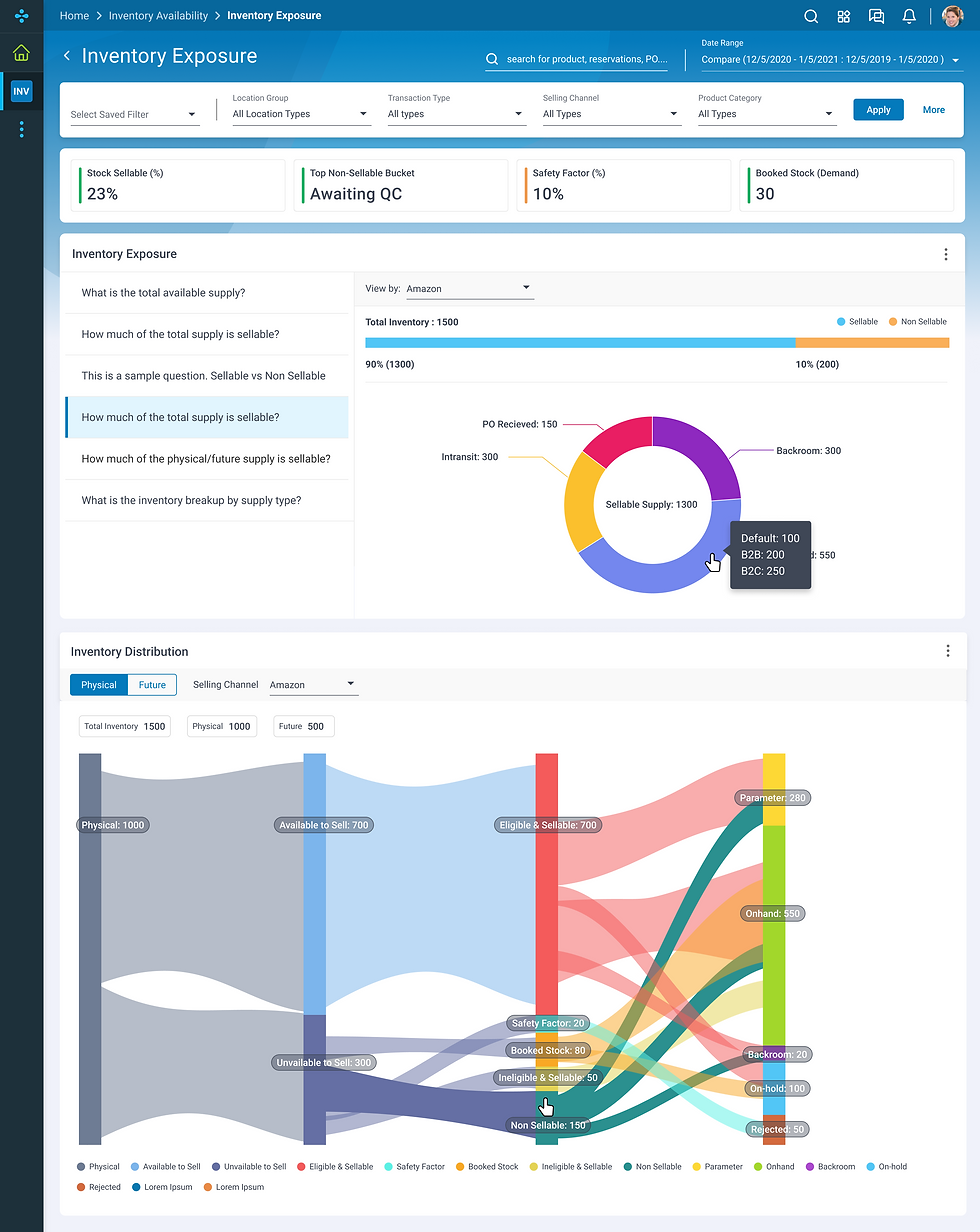
Inventory Exposure
-
This Inventory Exposure Dashboard gives visibility into sellable vs. non-sellable supply through KPI cards and detailed breakdowns.
-
It uses bar and donut charts to explain total inventory, sellable quantities, and contributing factors like POs, in-transit, and backroom stock.
-
A flow-based Inventory Distribution visualization further clarifies how physical and future inventory moves across categories, highlighting constraints like safety factors and booked stock.
Product ID Unique Page
-
As a store or inventory manager, this Product Detail Page helps track a single product’s performance in detail.
-
KPI cards quickly show open purchase orders, days of supply, exposure rate, and daily demand, while donut charts split sellable vs. non-sellable inventory across current and future stock.
-
Supporting visualizations highlight availability, safety stock, demand across channels, and inventory trends over time, enabling better forecasting and faster decision-making.

So to summarize, we designed an inventory availability system that:
Reduce operational inefficiencies,
Balances supply and demand, and
Supports both immediate decisions and long-term planning.
Product Success

Create Your First Project
Start adding your projects to your portfolio. Click on "Manage Projects" to get started
